Data Updates: The Primary Dealer Survey, the best survey you never heard of!
Welcome Back to this edition of the Macrodispatch, imagen a world where the primary dealers and selected financial institutions had to fill out a survey with a bunch of data with questions like:
Please indicate your modal projections for headline and core PCE inflationfor each quarter. Please provide your responses to at least one decimal place.
The Probability of a global economy being in a recession in 6 months
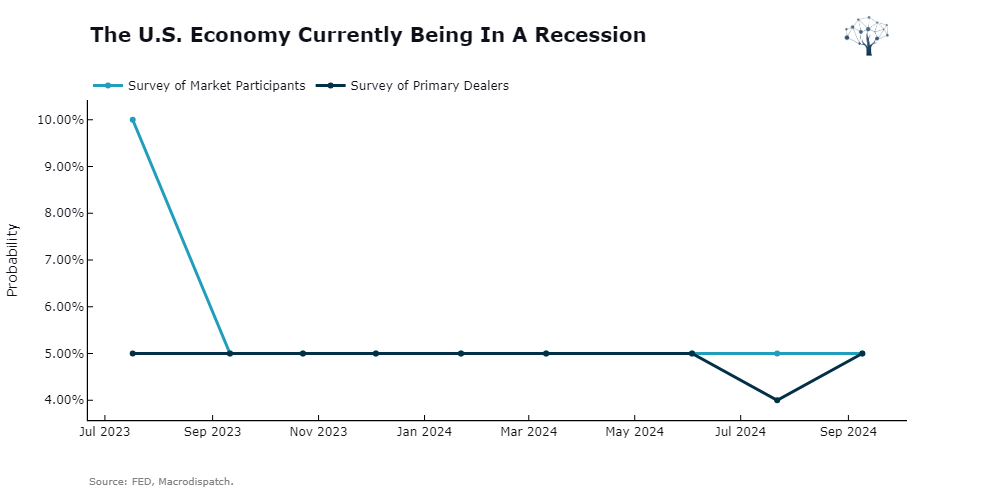
The Probability of the U.S. economy currently being in a recession
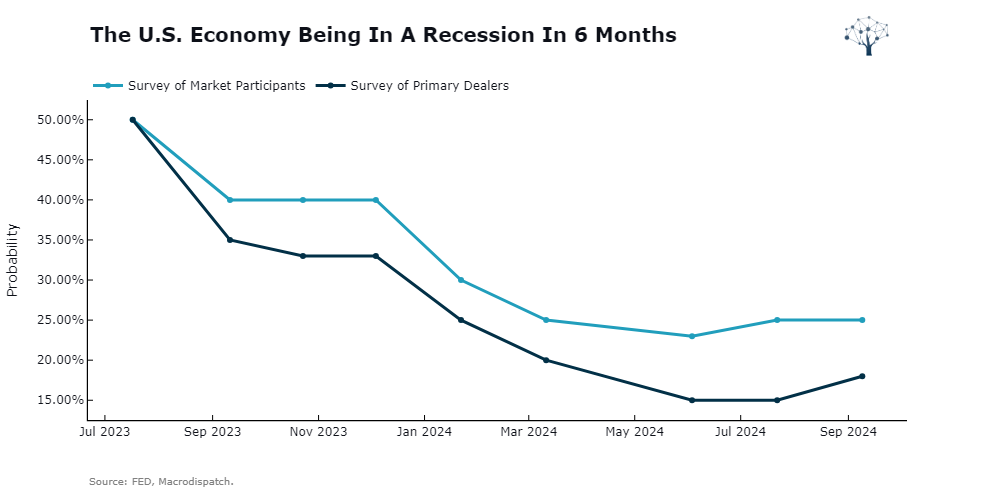
The Probability of the U.S. economy being in a recession in 6 months
That is the World we are going to talk about this week!
This has existed for 10+ years, but they only recently cleaned up the data and made it available to the public.
Since it's the first exercise of exploring this data, here are a couple of interesting charts ive put together for you!
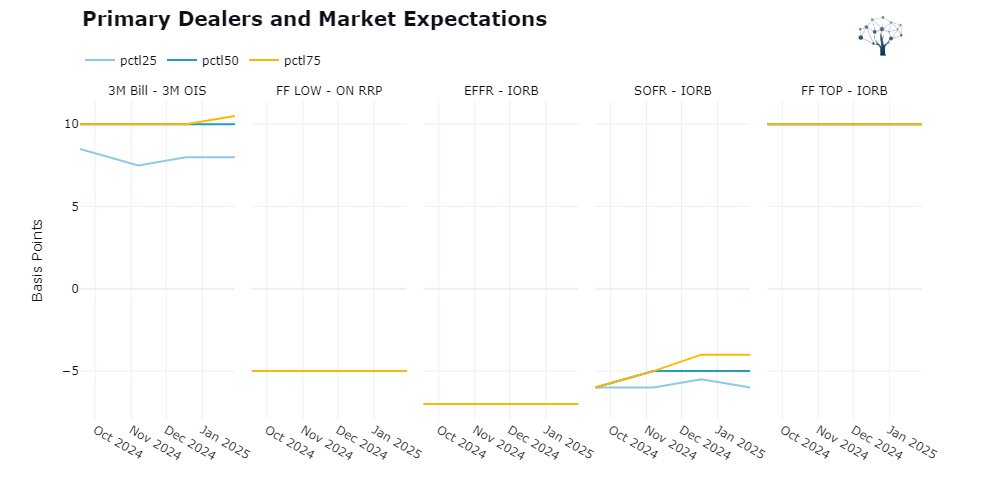
We can observe the Expectations for specific Money Market Spreads over the next couple of FOMC meetings or the lack of change in expectations for most spreads.
The SOFR-IORB is the only one that might tighten a bit. It signals that balance sheet space is not always plentiful, and things could get tighter. Month-end and quarter-end spikes can happen more often, although the Market is better equipped to prevent spikes of the size of the September 2019 repo spike (SRF). However, not all participants have access to it, which has been an ongoing discussion in the policy space. There are no signs that they will open up the SRF for now.
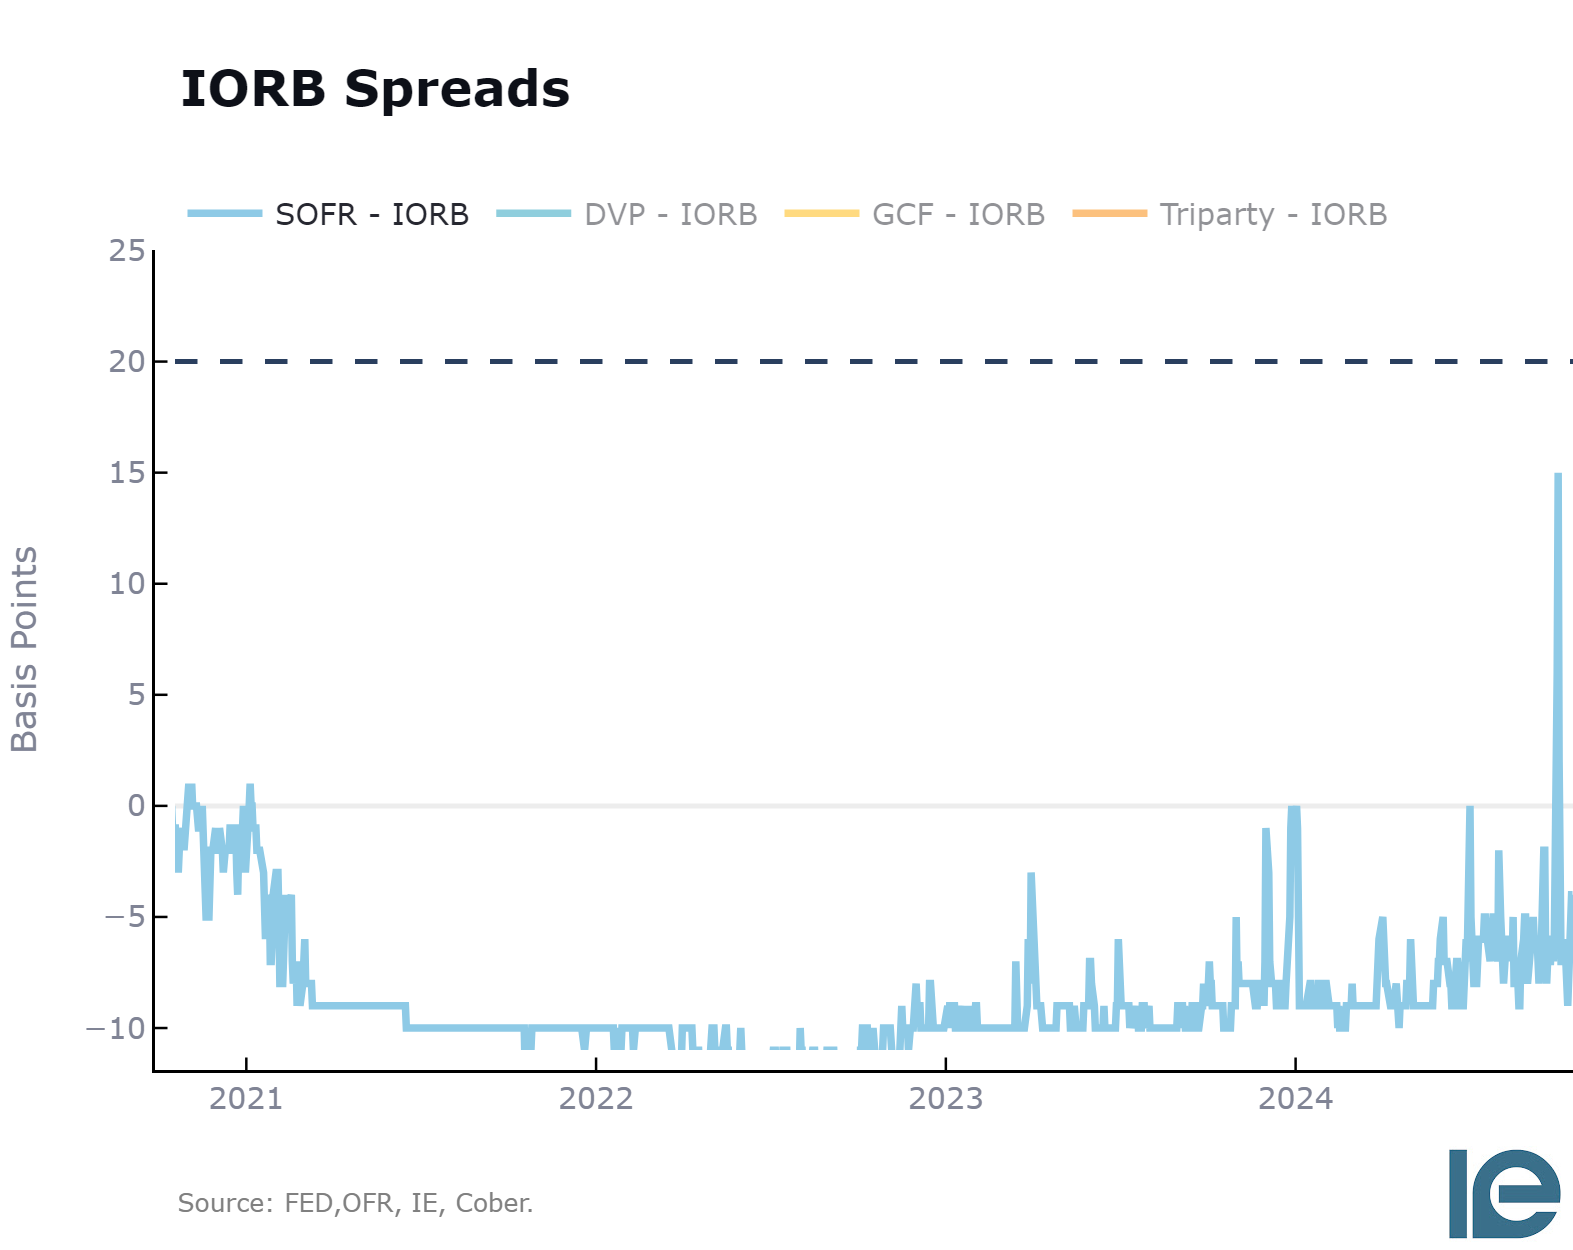
Looking at the live view of the SOFR-IORB from our stir monitor, the spread has been tightening over the past couple of months,
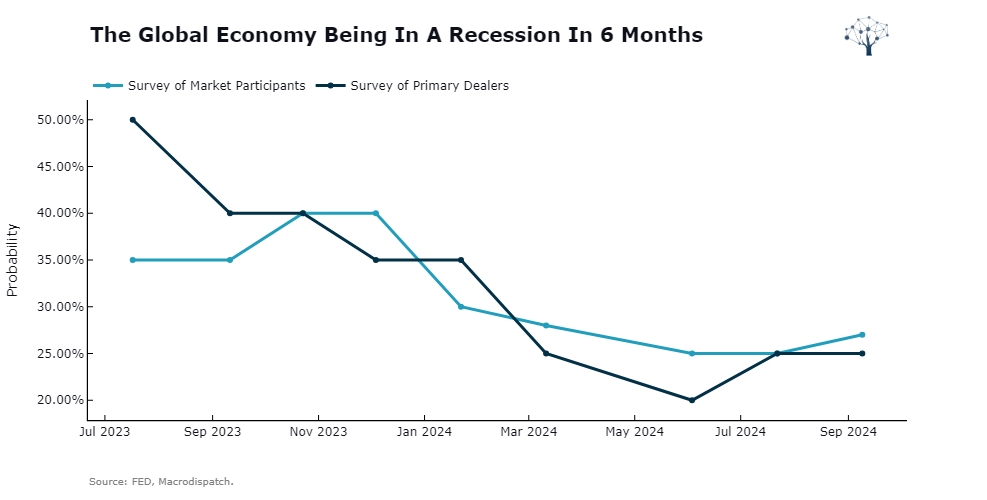
Now for the probability of recession, the survey points to a residing NO from the primary dealers estimates 5%, constant wich is just to say there always the likelihood of a external shock from left field.
But Looking Forward, expectations for a recession in the next couple of months have also been dropping, as the Soft Landing Narrative has been gaining traction, beating out narratives like the Drawdown of Excess Savings or The Inversion of the yield curve probit Models.
The probability is still not zero, but it has been falling both for the U.S. Perspective and global perspective.
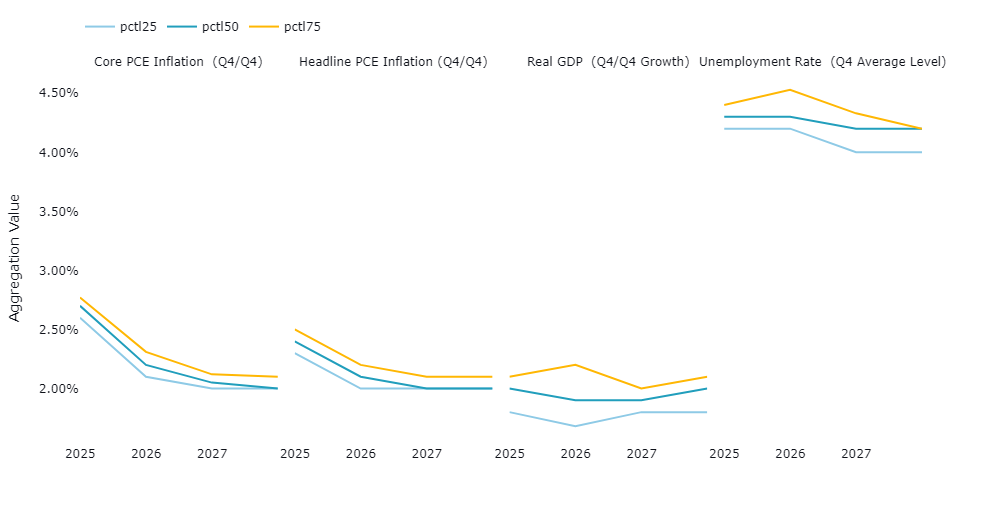
We can also examine the expectations for the main macro variables over the next couple of years.
The prognosis is simple, nothing magical on this front:
2-2.6% inflation
2% Real GDP and
4.2-4.3% Unemployment Rate
We will continue to explore this dataset and bring insights in the next Data Updates as we consider how to integrate this data into the STIR market report!
For our second, more data-centric update of the week, we will explore how to update our COT report with new data and visuals!
To maximize the Look at the futures market!
Our First Step is interactive tables to explore how managed money is positioned in the space and the recent trend, five-year Percentiles for positioning context, and a net trend micro chart to show the recent updates.
There's more to come.

And here's the interactive version that will be available soon; I'm still working on it!
| CFTC Market Data | |||||||
| Market ID | Long Positions | Short Positions | Net Position | Net Trend | |||
|---|---|---|---|---|---|---|---|
| Long Contracts | Long Percentile | Short Contracts | Short Percentile | Net Position | Net Percentile | ||
| NY HARBOR ULSD | 25.7K | 14.94% | 45.1K | 93.49% | −19.4K | 4.98% | |
| GASOLINE RBOB | 58.8K | 19.92% | 19.3K | 71.65% | 39.5K | 17.62% | |
| CRUDE OIL, LIGHT SWEET-WTI | 7.13K | 13.41% | 53.7K | 100.00% | −46.5K | 1.53% | |
| WTI-PHYSICAL | 192K | 5.75% | 60.9K | 53.26% | 131K | 15.71% | |
Source: CFTC,Openbb, Macrodispatch. |
|||||||
And for this week, that is all, Folks. I hope you enjoy this edition. If you read it until here, know that you're awesome!
Share it with a friend,
Obrigado,
Cober
Member discussion