It's time we talked about Liquidity!

Hey, this is cober speaking, and welcome to the first edition of the MacroDispatch!
This Past few weeks, we have all been bombarded with double-axis charts with the S&P X US liquidity Indicator.
The liquidity Indicator in most of these charts is a composite following Federal Reserve Time Series: FEDs balance Sheet - (Treasury General Account + Reserve Repo), or its abbreviation format: BS - (TGA + RRP).
Usually it's accompanied by some macro commentary on why US Stocks should go up or Down.
At its core, it implies that this equation can and will explain stock market returns over some period.
So in this article, we will explore the question using a linear relationship model how much liquidity changes can explain stock market returns over time?
We go through the following steps :
- Gather the data.
- Take rolling changes.
- Calculate how much liquidity can statistically explain the changes in stock market returns for a window for X amount of Weeks!
For our initial model, we are using 52 weeks rolling changes for the liquidity Indicator and the SPY ETF since 2003. After processing the data, these are the results:
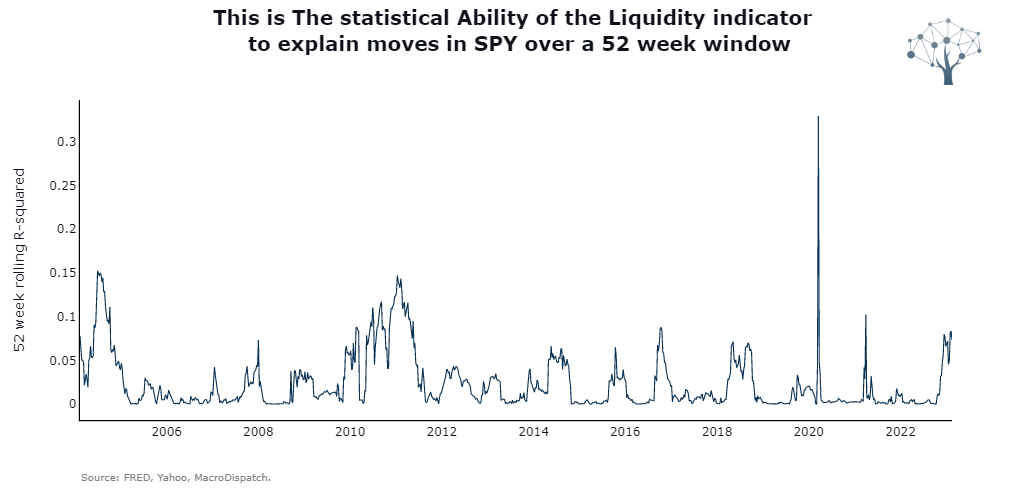
As we can see, the results suggest that sometimes over a year, the statistical ability of this indicator to explain SPY returns over the same 52 weeks is, on average, 2% with a standard deviation of 3% and a maximum value that is an outlier during the covid pandemic of 33%. A valid caveat worth exploring is the statistical significance of that data point might be interesting since it did not hold for long.
Over the past couple of months, with QT (Quantitative Tightening) and the recent growth of the RRP (Reverse Repo Facility), the reliability of the indicator has grown a bit but still hovers around 10%.
With our experiment done! If you found value in this week's edition, please share and subscribe to receive our latest interactive reports and deep dives! and Test out the tool below!
Try out your Own Version
We invite you to run your own version with your own biases and time frames!
If you think this indicator could be more useful to explain a certain Fixed Income, Commodities, Currencies, Equities ETF returns over a different time period try it yourself accessing our interactive tool below!
If you want to partner to test other liquidity Indicators and Build a similar interactive tool that uses a more refined version of a liquidity indicator with a other data series just contact me cober@macrodispatch.com.
Thanks for Reading until here! Till next time!
Member discussion