Decoding the Commitments of Traders (COT) CFTC Report: Insights into Market Participants

Welcome Back!!
This week's piece follows this structure:
1. What is the COT Report
2. One way of interpreting a couple of data points in the report, with an example of the Wheat Market
3. A tool for looking at the full picture and generalizing to more future contracts.

If you're in the commodities sector, especially trading, you hear about The Commitments of Traders (COT) report.
Quick Explainer Guide if you're new to the subject!
The COT report, published by the U.S. Commodity Futures Trading Commission (CFTC), provides valuable information about market participants' positions and activity in various futures markets.
Here is a quick explainer from the CFTC Itself:
Disaggregated Futures COT-- The Disaggregated reports are broken down by agriculture, petroleum and products, natural gas and products, electricity and metals, and other physical contracts. These reports have a futures-only report and a combined futures and options report. The Disaggregated reports break down the reportable open interest positions into four classifications:
- Producer/Merchant/Processor/User
- Swap Dealers
- Managed Money
- Other Reportables
Please see the “Disaggregated Explanatory Notes” for further information.
4. Traders in Financial Futures -- The Traders in Financial Futures (TFF) report includes financial contracts, such as currencies, US Treasury securities, Eurodollars, stocks, VIX, and Bloomberg commodity index. These reports have a futures-only report and a combined futures and options report. The TFF report breaks down the reportable open interest positions into four classifications:
- Dealer/Intermediary
- Asset Manager/Institutional
- Leveraged Funds
- Other Reportables
Please see the “Traders in Financial Futures Explanatory Notes” for further information.
Now that you're too speed, this piece will cut through the BS and propose a couple of known ways to visualize insights derived from this influential dataset and help understand in which asset class this data is more relevant - AKA where the loved/hated linear regression says position can explain weekly price moves!
We will focus on this Extreme Positioning of speculators!
The general idea is that Unusually high or low positions in the COT report can indicate potential market imbalances or the presence of overcrowded trades.
For example, extreme positioning by speculative traders may suggest an overbought or oversold condition, potentially leading to a reversal in market trends.
The methodology is simple.
Let's do an example using a unique asset before we generalize this idea:
First, we want an overall view of the market and where everyone is positioned in the futures market! To make it more interesting, let's look at Wheat, where geopolitical events had a big role in shaping speculative interest in the sector:
Can we see that in the data?

We can observe that after the war and the spike in wheat prices, as soon as weakness in price action was observed on Jun 24 of last year:

After this fact, money managers started to do a multi-month pile-in to short positions. At the peak, its temporary position was 49.7% of Open interest, and its net positioning was a three-sigma which is very extreme.

They recently started reducing their net exposure by adding longs after a dam explosion at the start of Jun made wheat prices rise again and put geopolitics in focus again for the price formation of this market.
While the COT report offers valuable information, combining its findings with a broader macroeconomic analysis and other relevant market indicators is where the magic is to gain a comprehensive understanding of market dynamics.
It's also relevant to point out that, over time, the contribution of COT to explain price formation can vary, and it's higher or lower in different markets; that will depend on how developed and important is the futures market for the unique asset you are analyzing.
In simpler terms, it is a more reliable indicator to use in commodity futures relative to Financial futures.
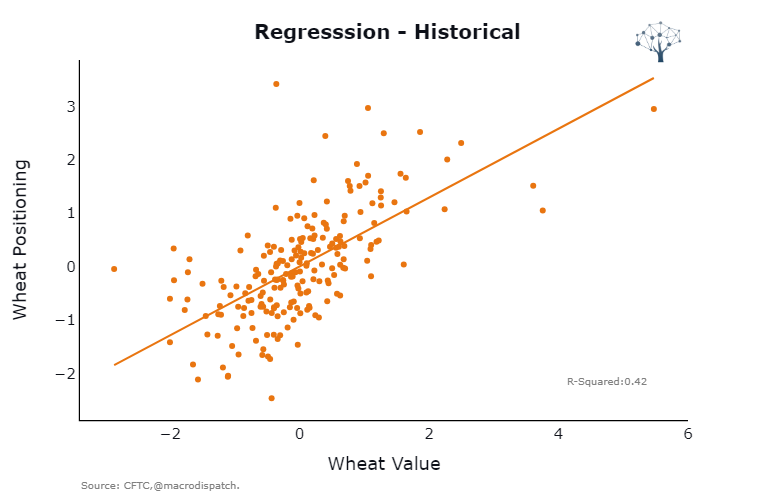
Let's go deeper into this: the rate of change of z-scored wheat positioning can explain 42% of wheat's future weekly price changes.

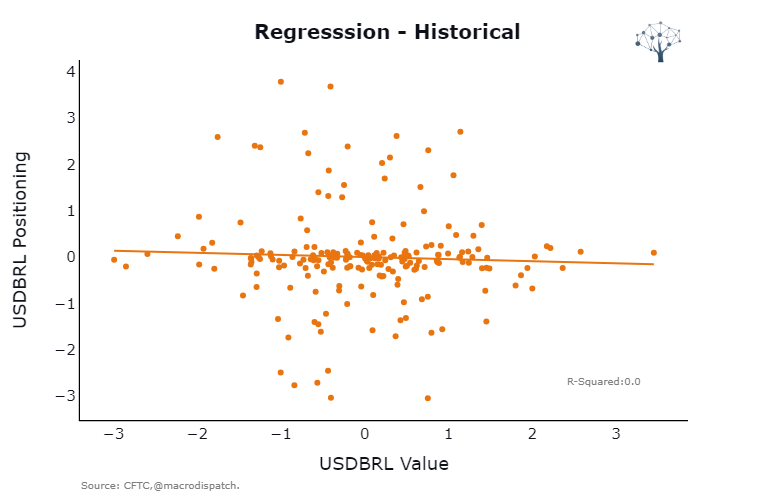
The relationship is nonexistent if we look at a less liquid market like USD BRL.

So given this context, we can use the following formula to understand the context behind futures market data:
Look at the extreme value of positioning and the historical relationship between price moves and positioning.
Doing this exercise, we can see how extreme the positioning in managed money in Wheat in wheat was 4 and 8 weeks ago, but it started to normalize recently, and it's down from 2.41 to 0.98 score.

This exercise can be repeated for multiple commodities and FX and has a broader overview of the general positioning for an overall market.
Feedback and ideas are welcome; I hope you have enjoyed it until next week! If you gained value, share it with your friends and sign up for the newsletter!
Tool Time
Available for educational and informational purposes only!
The tool is still in beta, with many ongoing projects, but I think it's worth sharing! Still struggling to merge o a couple of historical series, especially energy products. The latest RBOB contract, as an example, only goes back to 2022, so... CFTC, get your data cleaned!!
After these warnings, here's the link tool. I hope you enjoy it!

Member discussion