Understanding Beta #1
Welcome Back, I have been on long hiatus and will be more active with actionable and useful macro tools and reports I will go through short articles explaining a couple of concepts.
Let's start with the Basics.
Market Beta: is a measure of systematic risk, also known as non-diversifiable risk. It quantifies the sensitivity of an investment's returns to fluctuations in the market as a whole.
The beta coefficient is calculated by comparing the historical price movements of the investment to a benchmark, often represented by a market index like the S&P 500 (we will use SPY as a first example).
The Basic go around is that you can have a beta lower, higher, or equal to one; let's go through each case:
A beta equal to 1 means the investment moves with the market. If the demand increases by 1%, the asset increases by 1%. If the market drops by 2%, the investment drops by 2%. This shows the investment has the same volatility as the market.
A beta below 1 suggests the investment is less volatile than the market. For example, a beta of 0.7 means the investment tends to move 70% as much as the market.
Conversely, a beta coefficient higher than 1 indicates that the investment is more volatile than the market. A beta of 1.5 means the investment is expected to move 1.5 times as much as the market.
Let's see this in practice:
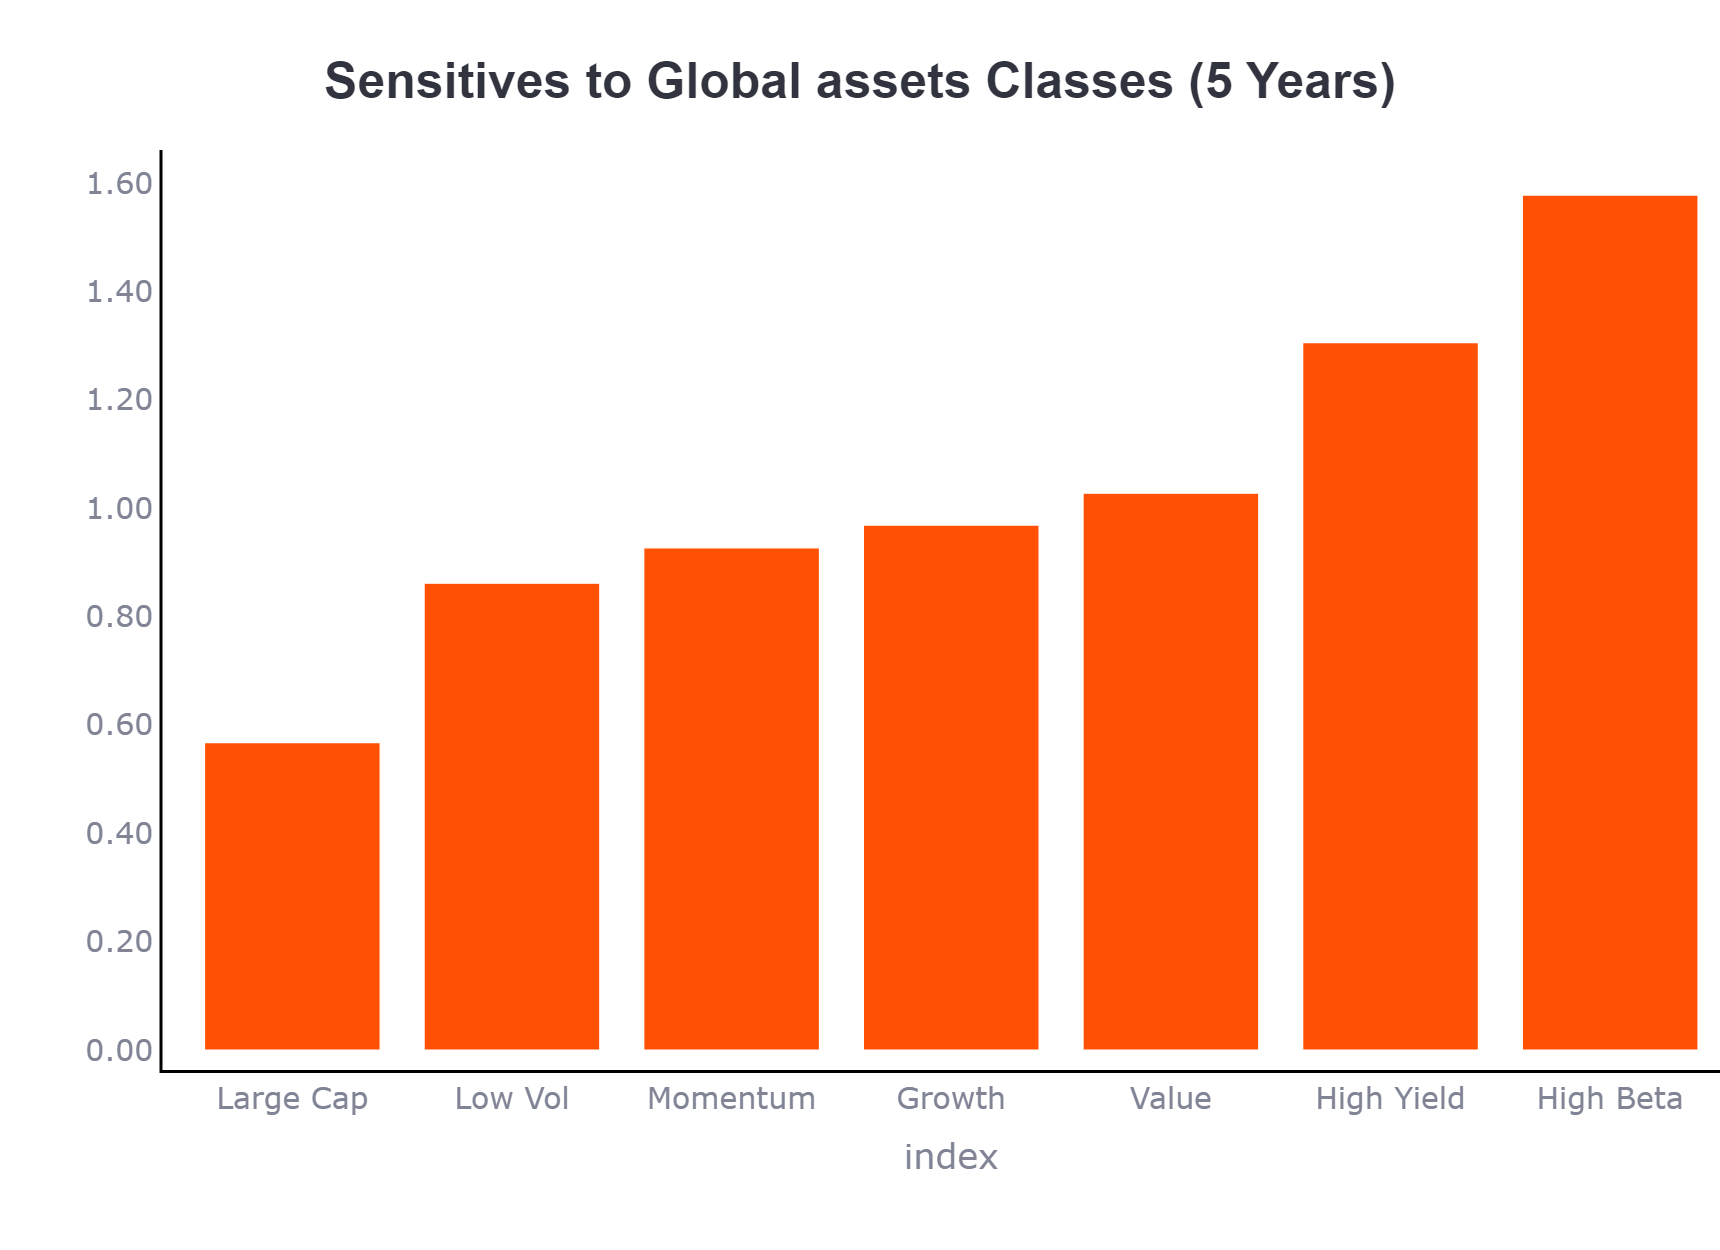
By plotting a couple of factors ETF Beta versus SPY, we can see the concept of Market beta in practice with High Beta having a beta coefficient higher than 1 and the low vol (AKA Low Beta) ETF having a value lower than 1.
This uses five years of daily rolling returns for the calculations.
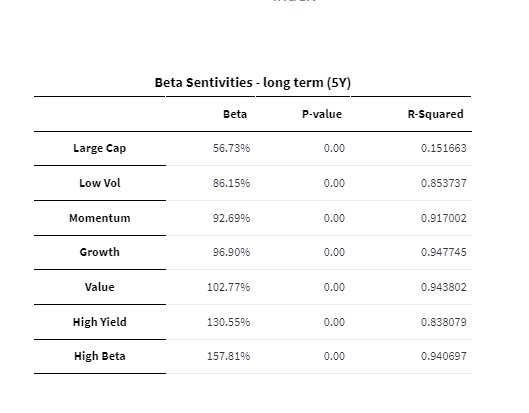
Also, while analyzing Beta, you should pay attention to two other values, p-value and R-squared:
The first, p-value, will tell you in a binary way if you can trust the Beta. If higher than 0.05, you shall not trust it.
After passing the first test, you look to R-squared, which will tell you exactly how much you can trust the beta and how stable that relationship is - the closer it is to one, the less volatile it is and, therefore, more trustworthy.
At the End of the data, Beta is just the best guess we can make based on historical data.
Therefore, Market beta is an essential tool for diversification, and investors can better move around their exposure to specific market risks.
One can explore their beta exposure to the market, but also, while scanning for new positions, you can use this same concept to choose expressions of your view more wisely. We will review that concept in the next edition of exploring the interpretation of relative beta an, if possible, tail beta, if you're interested subscribe.
But for now, you can peek into the Interactive tool that underlies the concept, explore the SPY relationship with different asset classes, and analyze it on your terms.
The app has a lot more functions and ideas for future development so there's more to come:
Access it below:
Member discussion